Front Page
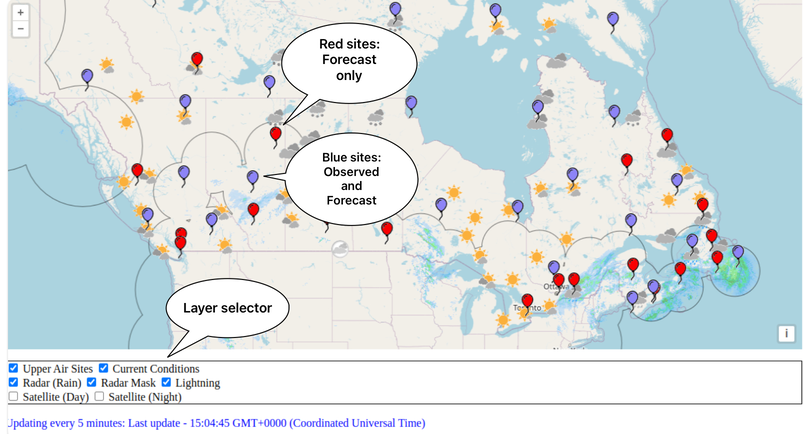
Upon landing on the main page at tephigram.ca, users are presented with an OpenLayers map of Canada.
This map is scrollable and zoomable in the typical fashion. On this map the sites with upper air data are presented.
Sites with a blue balloon icon have both observed and model profile data; sites with a red balloon icon contain
only model profile data.
Beneath the map is a layer selector, where a few data sets can be toggled on or off. These dataset sets include:
- Upper air sites
- Current conditions (may require zooming in a bit)
- Radar (rainfall rate)
- Radar mask (outline of radar extent)
- Lightning density (small dots!)
- Satellite (visible for daytime)
- Satellite (infrared for nighttime)
Data Controls
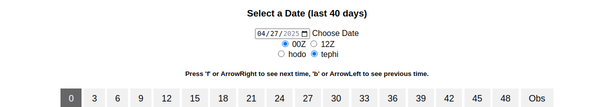
When a user clicks on a balloon icon, by default the most recent 00UTC or 12 UTC tephigram image will appear.
The data is available approximately 4 hours after ascent time of 12UTC or 00UTC. At the top of the tephigram page
(as well as the hodgraph data page when selected) are controls allowing which data to view. The radiobuttons
immediately beneath the date selection allow the user to choose the 00UTC or 12UTC data. The next set of
radiobuttons allow the user to view the tephigram data or the hodograph data.
Clicking on the date selection box ("Choose Date") will allow the user to choose a day within the last 40 days.
In the case of observed data, the is the date of the data; in the case of model 'data', the date represents the
model runtime date. Model 'data' is available for 48 hours from the model runtime - in 3 hour increments.
The buttons below the date selection control allow the user to see the model forecast data profiles at that hour.
Tephigram

When viewing the tephigram data, the user is presented with the observed or model vertical profiles of
temperature (blue), dew point temperature (green) and wet bulb temperature (black). The numerical value
of the data is presented at the top, right-hand side of the image. Some basic analyses of the data is
presented below the data.
The image above explains the other information available on the tephigram page. Note: the vertical
motion vectors are only available on the model 'data'.
Hodograph
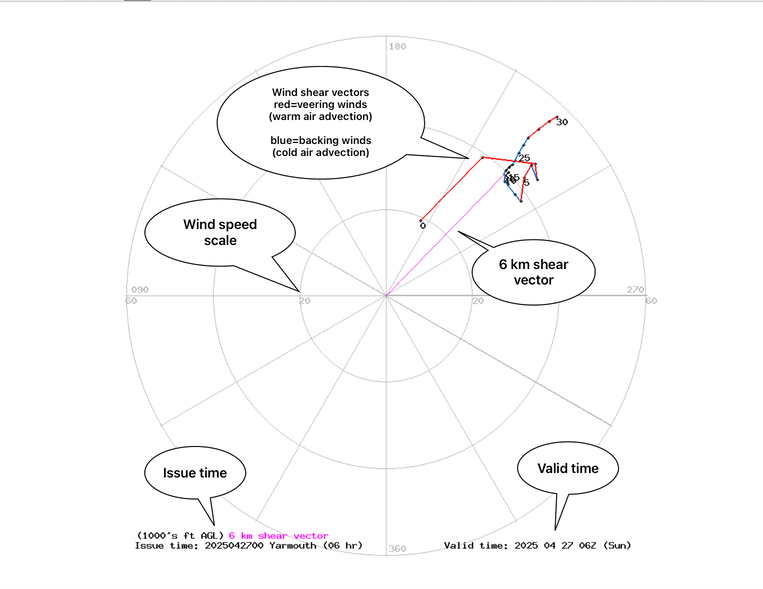
When the hodograph radio button is chosen, the user is presented with a simple hodograph.
The shear vectos are color-coded for ease of reading: veering winds (warm air advection) are red,
backing winds (cold air advection) are blue. The mean 6km shear vector is displayed in purple.